mira.pl.plot_scatter_chromatin_differential#
- mira.pl.plot_scatter_chromatin_differential(adata, gene=None, color=None, layer=None, ax=None, title='', size=3, linecolor='grey', palette='viridis', show_legend=True, hue_order=None, na_color='lightgrey', vmax=None, vmin=None, figsize=(5, 5), plot_kwargs={})#
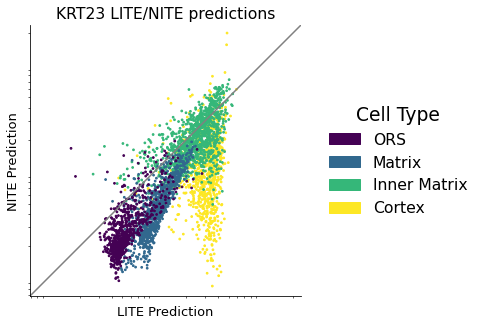
Plots chromatin differential scatterplot with more flexibility for coloring cells. Useful for studying temporal and cell-type relationships between LITE and NITE facets of gene expression.
- Parameters
- adataanndata.AnnData
AnnData object, LITE_prediction and NITE_prediction layers.
- genestr
Gene for which to plot LITE and NITE predictions.
- colorstr, default = None
With which column to color cells on plot. If none provided, colors by gene’s values for layer.
- layerstr, default = None
Which layer to access for color.
- plot_kwargsdict[str, any]
Dictionary of keyword arguments to pass to backend matplotlib.pyplot.scatter function.
Examples
>>> mira.pl.plot_scatter_chromatin_differential(
...     data, gene='KRT23', color='Cell Type',
...     palette='viridis', title = 'KRT23 LITE/NITE predictions')