mira.pl.plot_eigengap#
- mira.pl.plot_eigengap(adata, basis='X_umap', height=2, aspect=1.5, size=0.3, eigengap_figsize=(7, 4), palette='plasma', plots_per_row=5)#
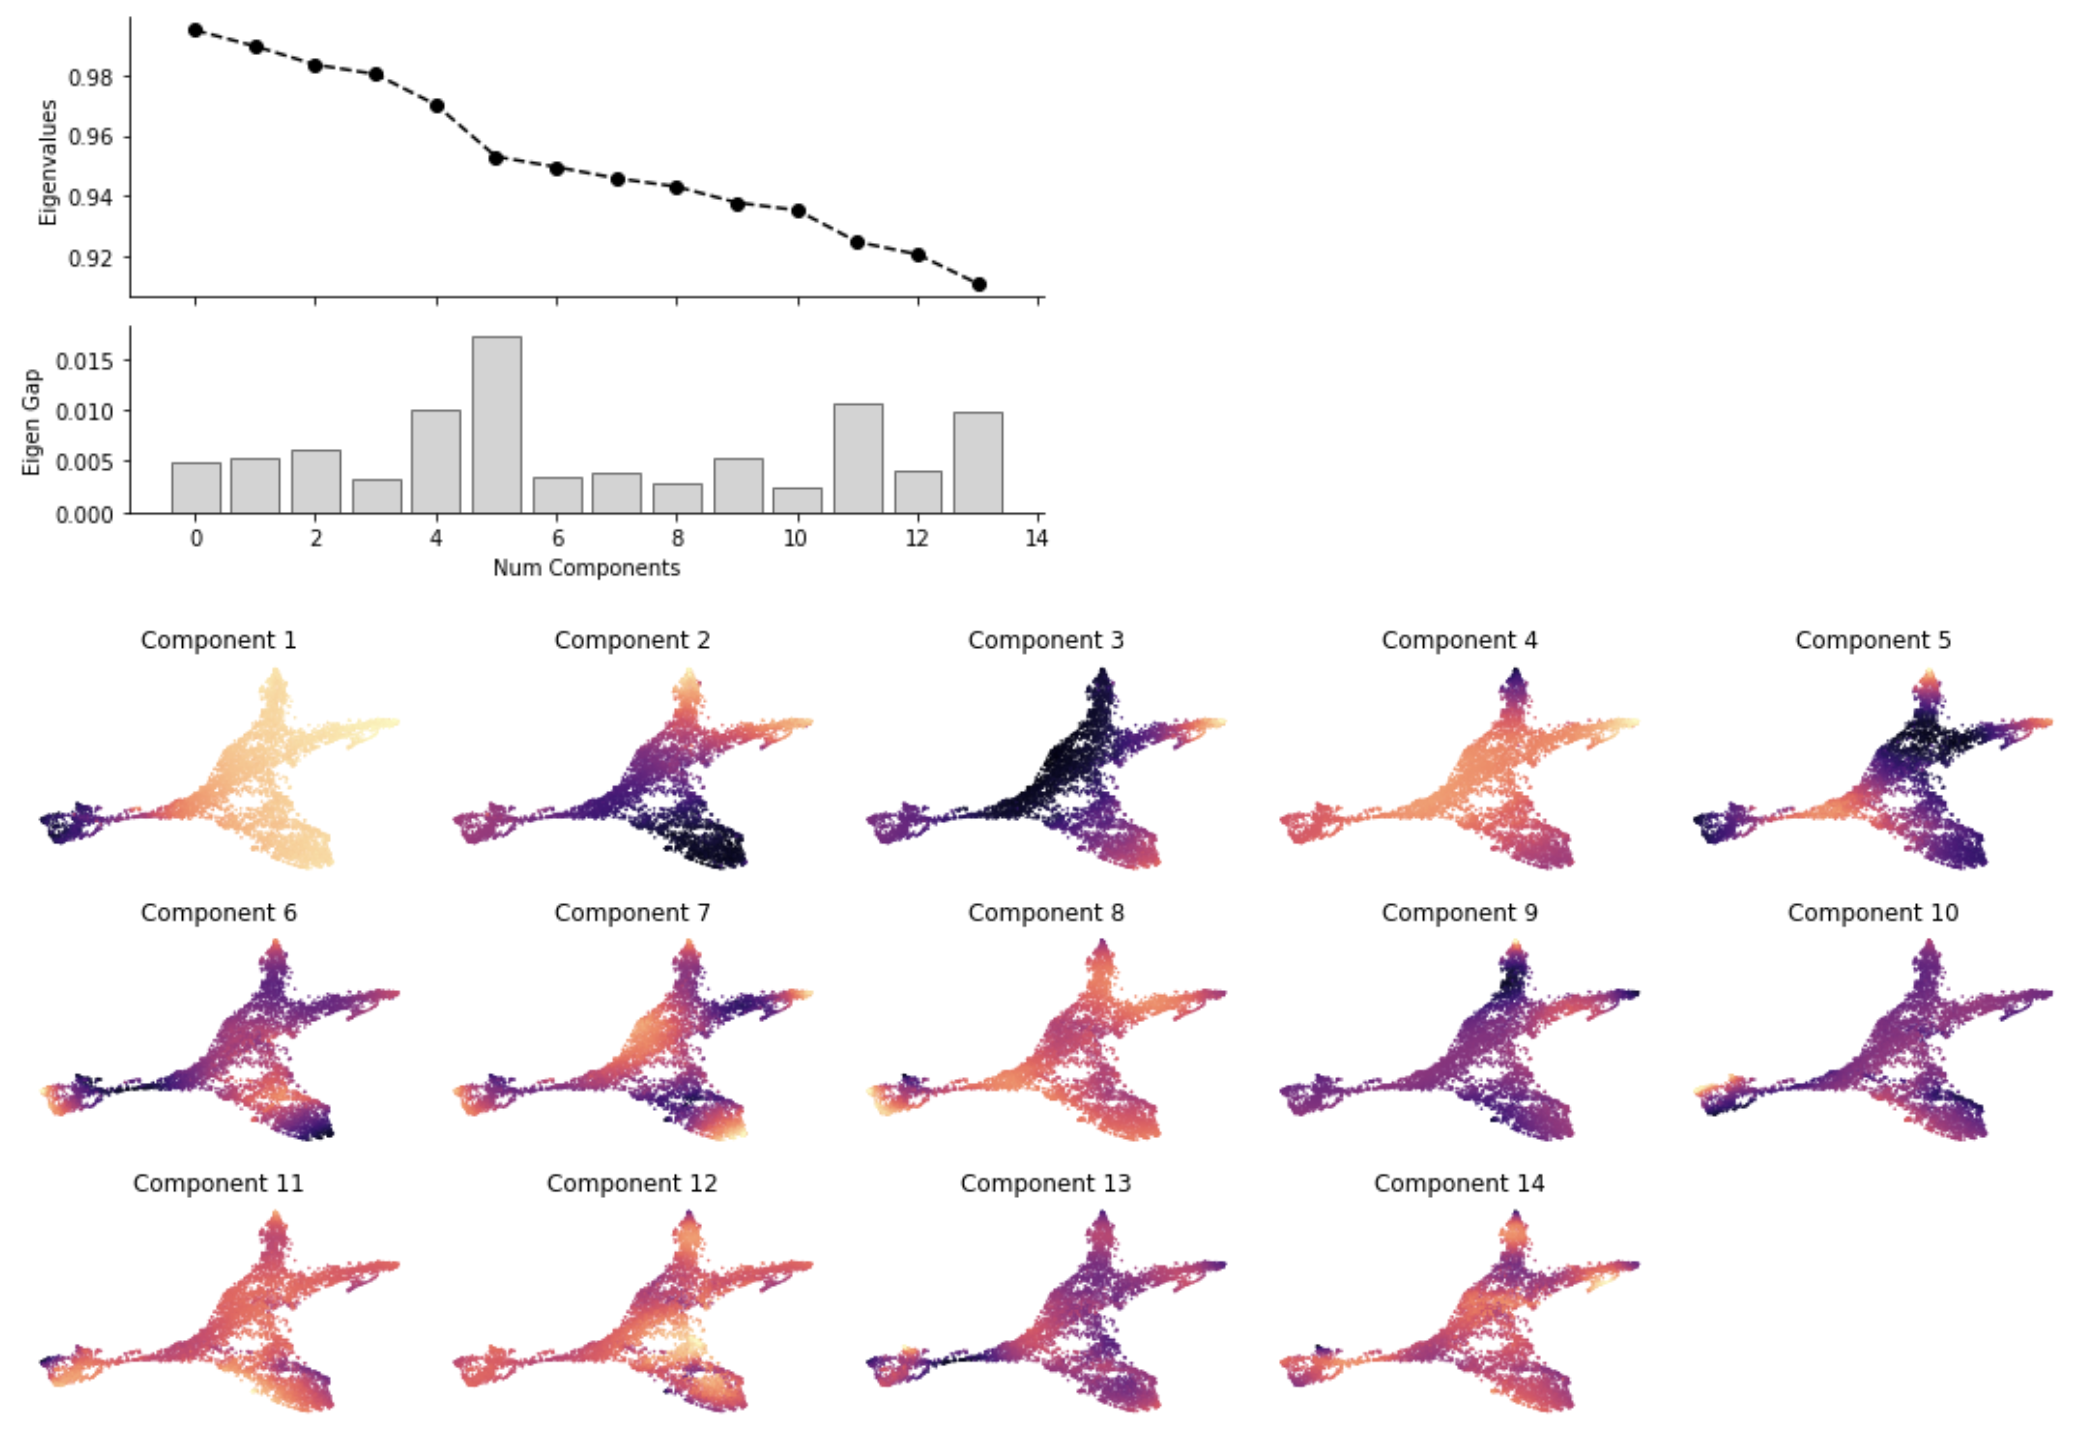
Plots the eigengap, the difference between consecutive eigenvalues, for estimation of the optimal number of diffusion components to represent dataset. Also plots diffusion components projected onto the UMAP basis. This allows the user to check to make sure that each cell population is captured by the components.
- Parameters
- adataanndata.AnnData
Adata with diffusion map in .obsm[“X_diffmap”] and eigenvalues in .uns[“diffmap_evals”]
- basisstr, default = “X_umap”
Representation basis for arranging cells. By default, uses the representation in .obsm[“X_umap”]. Only the first two components will be used of any representation.
- heightfloat > 0, default = 2
Height of each UMAP plot
- aspectfloat > 0, default = 1.5
Apsect ratio of each UMAP plot
- sizefloat > 0, default = 0.3
Size of points on UMAP
- eigengap_figsizetuple(float, float), default = (7,4)
Size of the eigengap figure
- palettestr, default = “plasma”
Matplotlib colormap string for projecting diffusion components onto UMAP plots.
- plots_per_rowint > 0, default = 5
Number of UMAP plots per row
Examples
Following calculation and normalization of the diffusion map representation of the data using sc.tl.diffmap and mira.time.normalize_diffmap, respectively, one may use this function to estimate the number of diffusion components to use to calculate a new KNN graph based on diffusion distances.
This new KNN graph represents a de-noised version of the joint-KNN graph defined from topic compositions.
The estimate of the number of components is given by the component which has the largest Eigengap, of difference between successive components. For the hair follicle system, this was 5.
>>> mira.pl.plot_eigengap(data, palette='magma')
>>> plt.show()
Warning
The Eigengap heuristic may not always recommend the best number of components. For example, it may recommend fewer components than is needed to describe some subtypes of cells. In this case, select the fewest number of components that has a large Eigengap and includes components that describe all cell types in your system (as given by components projected to the UMAP basis).
Note
This function is part of the mira.time API and works with several others to help users understand lineage structures and dynamic processes in their data. Please refer to the pseudotime trajectory inference tutorial.